News
Impact of 2015 Oil and Gas Price Drop on Houston Real Estate
January 30, 2016
Houston is the intellectual center of the oil and gas industry in the world.
In McAlister Investment Real Estate’s effort to keep our clients informed on the Texas Housing and real estate market, we are issuing the follow up analysis to the January 2015 release of the “The Fall of Oil Pricing and Its Impact on Texas Real Estate.”
The drop in oil prices and its residual impact on the Texas economy continues to unfold and is front and center in the headlines for 2015 and 2016. This McAlister Investment report will reevaluation the variables, the short term and long term outlook, and their impact on the Houston and the Texas real estate markets. This report will evaluate the magnitude of the drop in the price of oil, the length of time it may remain low, and the impact on the growth in real estate values in Texas.
McAlister Investment is already evaluating new investment positions in 2016 and into 2017 as quality opportunities arise at depressed pricing amidst the cloud of negative headlines. Because of the persistent undersupply of lots for new home construction, both the Texas and Houston real estate markets are positioned to increase in value in 2017 thru 2019 as oil prices recover and job growth in re-accelerates.
Click here to view the full report: 01.2016 Oil Report - McAlister Investment Real Estate
Click here to download summery as PDF: 01.2016 Oil Report Summary- McAlister Investment Real Estate
The World has an abundance of oil and gas reserves. As past history has shown, when the supply of economically producible oil and gas reserves become low, prices rise, and production from previously uneconomical new sources increases. New techniques to find more oil and gas sources that can be produced economically will be discovered and evolve.
These new techniques include those that involve giant technological steps, such as the production of oil and gas from shale. When I was studying petroleum engineering and geological engineering in the 1960’s, the wisdom was that shale contained oil and gas, but it was not producible because it had porosity but not transmissibility. Porosity measures the amount of space within the formation that may hold oil and gas. Transmissibility measures the capacity of the formation to allow fluid or gas to flow through the formation. With shale, porosity, which is the open spaces within the formation that may contain oil and gas, is not connected and flow is impossible. Formations that have transmissibility have spaces that are connected and oil and gas can flow through the formation to the well bore then to the surface.
George Mitchell from Houston utilized an old technique of fracturing the formation to connect the spaces that contained oil and gas. The economic evolution of this one technique changed the available reserves of fossil fuel instantly and dramatically in the U.S. and the world. The U.S. saw its production of oil rise from 3.5 MMbbl /day in 2005 to 9.6MMbbl/day in 2015. The additional production capacity was credited directly to the new technique created by one man. There will be many more techniques that may come to fruition in the future, as more oil and gas is needed to meet current demand.
LONG TERM:
- Fossil fuels (Oil and Gas) will provide the majority of the world’s increasing energy needs for decades into the future.
- By 2035, world population will reach 8.7 billion people, a growth of 1.6 billion people.
- In 2035, the GDP/person will be 75% higher than in 2013.
- In 2035, China will be the world’s largest economy followed by the U.S. and India.
- China and India will be 1/3 of global population and GDP by 2035.
- China will become the largest contributor to the growth of the world energy demand over the next forty years.
- North America is positioned to be a net exporter of energy by 2016 or 2017. Between now and 2035, North
- America will produce 50% of “tight oil” and 30% of shale gas to fuel global demand.
- Global demand for fossil fuel will provide the majority of world energy by 2035.
The primary conclusion of the study of oil and gas production impact on Texas and Houston, is that the oil and gas industry will be the dominant component in providing worldwide energy demands into the future. Houston will be the focal point for the growth in oil related companies and Texas will be a major source for growing production volume. The long term view is that Houston and Texas will continue very strong growth in the exploration and production of oil and gas for many decades. The current downturn is the result of a temporary over-supply of oil relative to its demand. This is a relatively short to medium-term problem when considering the long term need for oil and gas into the future.
Texas and Houston’s real estate will return to the dynamic growth patterns seen over the last 60 years when the crude oil supply problem comes back into balance over the next few years. Re-balancing has already begun as less economical formations and wells reduce production.
BACKGROUND AND ISSUES – 2016:
- World crude production is approximately 95.7 MMbbl/d in 2015. World consumption of crude is approximately 93.1 MMbbl/d. This leaves a surplus of production in excess of demand of approximately 2.6 MMbbl/d
- The United States began producing large amount of oil from the shale deposits in 2009. U.S. oil production rose to 9.6 MMbbl/d in 2015 from 3.5 MMbbl/d in in 2005, creating a surplus of oil in the world market. This rapid growth of U.S. oil production is a major contributor to the glut in the market that precipitated the drop in price of oil.
- Currently, it is the U.S. and Saudi that control the supply of crude oil. Saudi is unwilling to cut production because of their desire to maintain low oil prices and attempt to reduce production from the U.S. The U.S. does not regulate production of individual producers. Economics dictate the volume of production by the U.S.
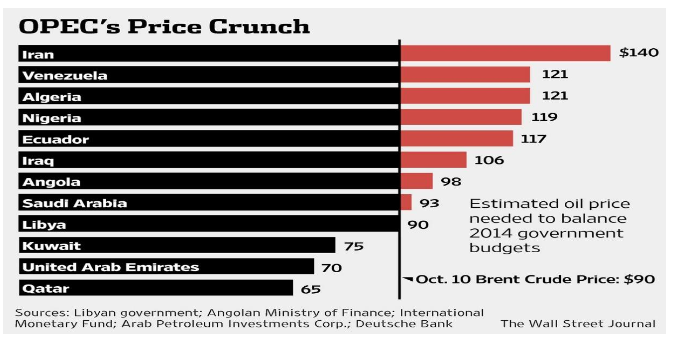
- There is an issue that may, in the medium-term, be a force that will call for higher crude prices: Most of the oil producing countries and particularly OPEC countries, depend upon crude oil exports for most of their revenue to meet their annual operating budgets for the country. Most OPEC nations including Saudi Arabia, need to have crude oil prices over $90/bbl to meet their internal budget needs. Only Saudi Arabia, and possibly Iran, among the OPEC cartel, has a sufficient cash surplus to ride out a multi-year term of low crude prices.
- The following table shows the price of oil necessary to balance the budget of prominent oil producing countries:
At the onset of the precipitous fall in oil prices, the Wall Street Journal summarizes the dependence of OPEC countries on oil revenue for their national budget.
Will the economic pressure from these and other troubled oil income dependent countries force a decrease in production and a rise in crude pricing?
BACKGROUND---PRODUCTION—2016:
- The U.S. has just begun to take full advantage of its shale oil reserves. Between 2012 and 2015, there has been a dramatic decrease in the cost of drilling new wells. Since 2012, initial oil production from shale oil wells is up 17% and 30% for gas wells. This increase is attributed to improved techniques an increased knowledge. Although new drilling activity has had a significant decrease since the 2014 oil price drop, U.S. production increased from 8.9 MMbbl/d to over 9.6 MMbbl/d from 2014 to 2015.
- For 2016, the U.S. is likely to see production decline as economics and the profitability of the new wells dictate. OPEC countries could see a rise in production. Iran is an unknown, but is likely to bring considerable oil and gas to the world market. Iran has over 40 Million barrels of oil in storage and is considered the ‘wild card’ since long standing international economic sanctions on Iran are being lifted which will allow Iran to sell oil to the international market.
- To date, energy companies have laid off over 200,000 employees world-wide. Drilling rigs in the U.S. have dropped from over 2,000 rigs daily drilling to under 700. However, Texas oil output reached 1.28 billion barrels for 2015, exceeding the state’s record of 1.26 billion barrels set in 1972 per the Texas Alliance of Energy Producers. For the month of July 2015, producers brought 14.5 Million barrels more to the marketplace than in July 2014. This gain in production is due to an increase in production efficiency with new methodology and techniques.
- Prior to the collapse of oil prices in late 2014, U.S. supply had been growing at approximately 100,000 bbl/d every month, Raymond James U.S. Research reports. They also forecast the current production decline in the U.S. will continue at a moderate pace until early 2016 and bottom out at approximately 8.9 MMbbl/d. if Iran is factored into the equation, it could be 2017 or 2018 when production bottoms out at less than 8 MMbbl/d.
- The U.S. oil production growth could possibly turn positive in 2017 and recover sharply in 2018 because of strong increases in initial productivity per well. Research from Raymond James U.S. Research suggests that the production from U.S. sources will surge in 2017 gaining approximately 900 Mbbl/d and gaining another 1.7 MMbbl/d in 2018. So while oil prices may show only modest increase, the increase of efficiency in well technology will allow for profitable productions of new wells. This does not include natural gas liquids which would have the same trajectory as crude.
- One of OPEC’s goals is to maintain market shares and to reduce production of shale oil from the U.S. by keeping the price of crude low. U.S. production will drop about 1.0 MMbbl/d to 8.6MMbbl/d in 2017, before the turn-around in prices.
HOUSTON:
Houston’s economy is displaying resilience despite the loss of jobs in the Oil and Gas sectors. Over the last 20 years Houston has developed a more diversified business climate. The job sectors outside of oil and gas are growing nicely. Leisure and hospitality, education and health services along with trade and transportation lead the way for job growth. When oil and gas prices fall, many other businesses benefit from lower energy costs. In particular, Houston’s downstream oil and gas refining is showing very strong growth with $50 Billion in petrochemical capital projects underway in Houston alone. The long term population growth for Houston and Texas are projected to remain strong.
- In 2015, Houston permitted over $6 Billion in residential and commercial projects in spite of the downward pressures on the Oil and Gas sector of the economy. This is a 12% drop compared to the same period last year, but no disaster.
- Of the 20 most populous metropolitan areas, Houston’s cost-of-living advantage is even more pronounced. Houston’s housing costs are 33% below the average for the large metro areas, and its overall costs are 19% below the national average.
- Both the Houston and Texas real estate markets continue to hold strong in this unsettled marketplace, as opposed to the serious problems Houston faced in the downturn of the 1980’s, Houston has a residential real estate market with a very thin supply of developed housing and lots for building housing. The opposite was true in the 1980’s when Houston had a massive over-supply of houses, lots, and rental space. Houston still has the most economical cost of living of the major U.S. cities.
Over the last several years Houston has had employment growth of between 95,000 and 110,000 per year, with a 15 year average of +/- 65,000.
- Houston projected job growth for 2015 is at 17,000 new Jobs. However, future expectations are for approximately 17,000 new jobs for 2016, rising to approximately 93,000 in 2018.
Houston lost jobs in only three sectors for year ending June 2015. The losses totaled approximately 10,000 jobs. The three sectors are manufacturing, financial and mining and logging.
- Houston single family housing permits are 28,758 units YTD through September 2015 as compared to 29,538 year to date for September 2014. Over 20,000 units are estimated to be constructed in 2016. The estimated home starts for Dallas and Austin are 25,000 and 11,000, respectively. Compare these Texas cities to other major U.S. cities as follows:
Washington, Arlington, Alexandria - 11,000 Units
Charlotte, Concord, Gastonia - 10,000 Units
New York, Newark, Jersey City - 10,000 Units
Los Angeles, Long Beach, Anaheim - 7,000 Units
Las Vegas, Henderson, Paradise - 7,000 Units
Even in a time of problems in the oil and gas sector of the economy, Houston continues to lead the U.S. in home starts.
- Year-to-date single family home resales in Houston were over 67,771 as of November 2015. Houston currently has only a 3.4 month inventory.
New homes under construction and finished vacant new homes reflect a 7.2 month inventory as of third quarter 2015.
Houston had a 16.6 month supply of vacant developed lots as of October 2015.
THE FUTURE:
The long term outlook is fundamentally sound for oil and gas producing companies to grow financially in order to meet the growing worldwide demand for fuel. Houston, Texas, and the US as a whole are well positioned to thrive under these conditions.
Fossil fuel is projected to supply two-thirds of the increased energy demand worldwide through 2035 and a larger percentage farther into the future.
The technological breakthroughs in shale production in the early 2000’s by the U.S. changed the game. By 2014, the U.S. was producing nearly as much oil as Saudi Arabia. The entry of U.S. shale production into the world market for crude oil will have a long-term impact because of the large reserves of U.S. oil and gas in the shale reservoirs and the ability of the existing reservoirs to produce large quantities for a sustained period of time.
The price of West Texas Intermediate (WTI) oil dropped from over $100/bbl in summer 2014 to the high$40s/bbl in late 2014. The price of oil is now in the mid to high $30’s/bbl. Real estate investors in Texas are trying to determine the impact of the oil price decline on Texas employment and real estate values. This leads to the major questions of when will oil prices recover and to what price level will they stabilize. The pundits are all trying to get a grip on these answers.
CONCLUSION:
Per Raymond James Financial and similar research firms, the general consensus is that oil will not move back to the lofty $100/bbl in the near term, but would settle near $70/bbl as early as 2017. These projections are difficult to predict as the supply can change quickly in the event that one of the major suppliers makes a unilateral change in the amount of oil it produces.
The conclusion is that the oil and gas industry is going through a temporary correction due to a production surplus created by the dramatic increase in shale production by the U.S. relative to declining world demand and the uncertainty of Iran and other OPEC production goals.